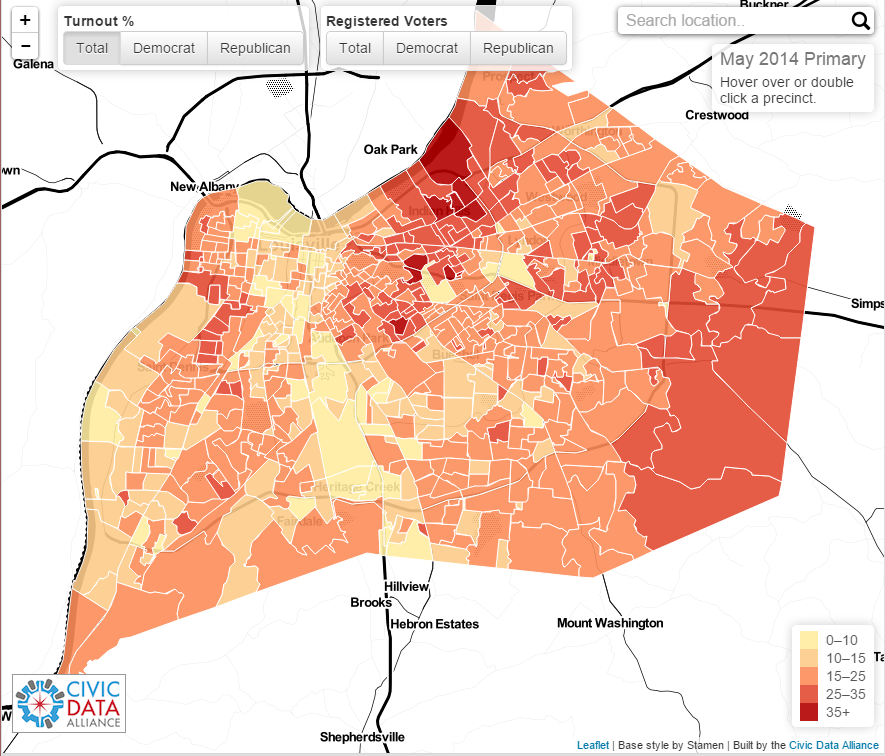
Louisville Voter Precinct Turnout Map
Secretary of State Grimes office recently released the turnout statistics for last May’s Primary Election.
We at the Civic Data Alliance thought it would be useful for organizations engaged in ‘Getting Out the Vote’ to visualize turnout across all Precincts in Louisville. Of course, Primary Elections typically have much lower turnouts than General Elections, but seeing last May’s Primary statistics on a map might help organizers target some of their current canvassing in areas with especially low voter turnout.
What’s unique about this visualization is that, as far as we know, no one has merged precinct outlines in Jefferson County with turnout results in an interactive map for the public before now.
Maps
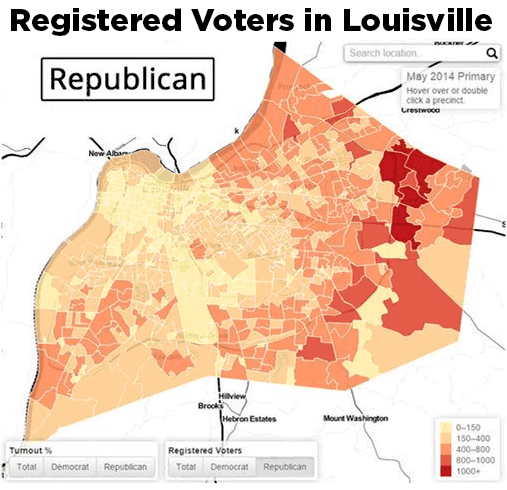
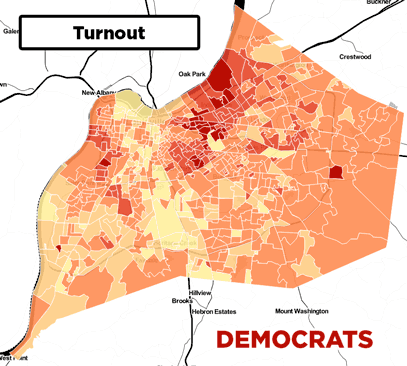
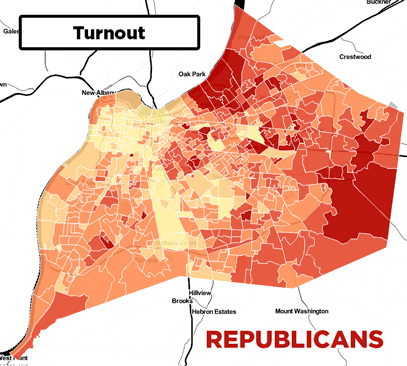
Precinct turn out for the May 2014 primary including registered voters, turnout numbers and percent. Includes breakdowns for democrats and republicans.
Process and Issues
Getting Data
- Obtained PDF of state-wide precinct data from SOS. Use OCR to digitize data. Made manual fixes to some data.
- Pay $10 and get notary for LOJIC to release Jefferson County precinct GIS boundaries and agree not to publish raw data.
- Convert GIS shapefile precinct data to more web-friendly KML format using QGIS.
- Called Jefferson County Election Center to get polling locations for free via email.
Open data issues included releasing raw data tables as PDFs, charging for access to public data, requiring a notary to get public data, signing agreements to not publish public data, and having to call to get data instead of a direct download.
Building Map
- Loaded all data sets into Mapbox tables, but then abandoned this method.
- Qgis was used to join polygons and data and then export to geojson
- Mashaper was used to simplify the line work in the resulting file to reduce file size.
- Wrote JavaScript to create a LeafletJS map.
- Collaboratively worked on code using Github and Trello.
- Added UI elements and designed map.
- Created new hosting location to put interactive map for the public.